GLOBAL CONCENTRATION OF ATMOSPHERE CO2

            GLOBAL CONCENTRATION OF 
                      ATMOSPHERE CO2 


Why in news?
On May 11, 2019 global concentration of carbon dioxide in the atmosphere was measured to have crossed the 415 parts per million (ppm) mark for the first time.
What are the recent observations?
  • The levels are as measured from Mauna Loa observatory in Hawaii.
  • On every subsequent day from May 11, the daily average atmospheric concentration of CO2 has remained over that level.
  • The rapidly rising concentration is one of the key indicators of the manner in which the planet has been warming up.
  • The higher the concentration of CO2, the greater the greenhouse gas (GHG) effect that causes the Earth’s atmosphere to heat up.
How has CO2 concentration been?
  • For several thousand years, the carbon dioxide concentration remained constant at around 270-280 ppm.
  • The industrial revolution started to slowly push this level up.
  • When direct measurements began at the Mauna Loa observatory in 1958, concentrations were around 315 ppm.
  • It took nearly 50 years for it to reach 380 ppm, a mark first breached in 2004, but thereafter the growth has been rapid.
  • Currently, the carbon dioxide concentration is growing at more than 2 ppm per year.
  • Scientists say the growth rate is likely to reach 3 ppm a year from this year.
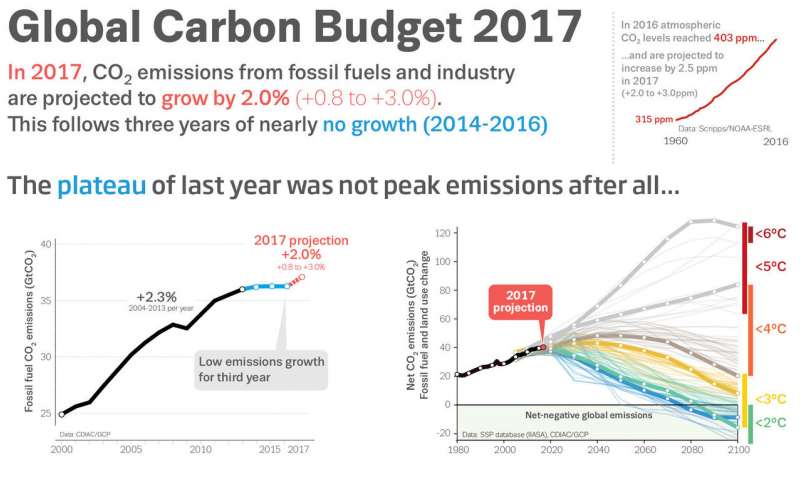
How is the emission scenario?
  • The increase in CO2 concentrations in atmosphere is caused by the emissions, mostly from man-made processes.
  • However, in recent years, the growth in global carbon dioxide emissions has slowed down considerably.
  • It remained almost flat between 2014 and 2016, and increased by 1.6% in 2017 and about 2.7% in 2018.
What raises the CO2 concentrations then?
  • The rapid rise in the atmospheric concentrations is due to the fact that C02 has a very long lifespan in the atmosphere, 100 to 300 years.
  • So, even if the emissions were to reduce to zero all of a sudden, it would have no impact on the atmospheric concentrations in the near term.
  • About half of emitted carbon dioxide is absorbed by plants and oceans, leaving the other half to go into the atmosphere.
  • An addition of about 7.5 billion tonnes carbon dioxide to the atmosphere leads to a 1 ppm rise in its atmospheric concentration.
  • In 2018, the global emission of carbon dioxide was estimated at 37.2 billion tonnes (about 18.6 billion tonnes after absorption).
  • The absorption of carbon dioxide by plants too follows a predictable seasonal variability.
  • Plants absorb more carbon dioxide during the summer.
  • So a lower amount of carbon dioxide is added to the atmosphere in the summer months of the northern hemisphere.
  • This variability is reflected in the very rhythmic seasonal fluctuation of atmospheric concentration of carbon dioxide.
How does it affect the temperature?
  • The global community's effort is to keep the rise in average surface temperatures below 2ºC higher than during pre-industrial times.
  • The carbon dioxide concentration level corresponding to a 2ºC rise in global temperatures is generally understood to be 450 ppm.
  • At current rates of growth, that level would be reached in less than 12 years i.e. by 2030.
  • Until a few years ago, it used to be understood that this milestone would not be reached till at least 2035.
What lies ahead?
  • A recent Intergovernmental Panel on Climate Change report called for a net zero emissions of all GHGs by 2075 to attain the 2ºC target (by 2050 for the ambitious 1.5ºC target).
  • Net zero is achieved when the total emissions is neutralised by absorption of carbon dioxide.
  • This is done through natural sinks like forests, or removal of carbon dioxide from the atmosphere through technological interventions.


Green – Ag Project

Green – Ag Project


  1. The government has launched a Global Environment Facility (GEF) assisted project namely Green – Ag in September, 2018.
  2. The theme of the project is “Transforming Indian Agriculture for global environment benefits and the conservation of critical biodiversity and forest landscapes”
  3. It has collaboration with the Food and Agriculture Organisation (FAO).
  4. The project has been launched in high-conservation-value landscapes of five States namely
  • Madhya Pradesh : Chambal Landscape
  • Mizoram: Dampa Landscape
  • Odisha: Similipal Landscape
  • Rajasthan: Desert National Park Landscape
  • Uttarakhand: Corbett-Rajaji Landscape
Aim and Objectives
  1. The project seeks to mainstream biodiversity, climate change and sustainable land management objectives and practices into Indian agriculture.
  2. The overall objective of the project is to catalyze transformative change of India’s agricultural sector to support and conserve critical biodiversity and forest landscapes.
  3. The project will support harmonization between India’s agricultural and environmental sector priorities and investments.
  4. The achievement environmental benefits can be fully realized without compromising India’s ability to strengthen rural livelihoods and meet its food and nutrition security.

‘PARIVESH’Portal

 ‘PARIVESH’Portal


What?
  • An ambitious web-based single-window system ‘Parivesh’ will be rolled-out at state levels by January 15, bringing an end to the clearance nightmare for entrepreneurs.
  • This automated clearance has already been implemented at the Central level, while various States starting from Gujarat will begin to implement the scheme by January 15.
PARIVESH Portal
  1. It is a Single-Window Integrated Environmental Management System which stands for Pro-Active and Responsive facilitation by Interactive, Virtuous and Environmental Single-window H
  2. It is a workflow based application and portal, based on the concept of web architecture.
  3. The system has been designed, developed and hosted by the Ministry of Environment, Forest and Climate Change, with technical support from National Informatics Centre, (NIC).
  4. It automates the entire process of submitting the application and tracking the status of such proposals at each stage of processing.
Utility of the portal
  1. It facilitates for online submission, monitoring and management of proposals submitted by Project Proponents to the MOEFCC, as well as to the State Level Environmental Impact Assessment Authorities (SEIAA).
  2. It will also he;p seek various types of clearances (e.g. Environment, Forest, Wildlife and Coastal Regulation Zone Clearances) from Central, State and district-level authorities.
  3. The main highlights of PARIVESH include –
  • single registration and single sign-in for all types of clearances (i.e. Environment, Forest, Wildlife and CRZ),
  • unique-ID for all types of clearances required for a particular project and
  • single Window interface for the proponent to submit applications for getting all types of clearances (i.e. Environment, Forests, Wildlife and CRZ clearances)
More efficiency to be achieved
The facility of Geographic Information System (GIS) interface will help them in analyzing the proposal efficiently, automatic alerts (via SMS and emails) at important stages to the concerned officers, committee members and higher authorities to check the delays if any.

Climate Change Performance Index (CCPI)

Climate Change Performance Index (CCPI)


Why in news?

Morocco has been named the second best performing country after Sweden in the Climate Change Performance Index (CCPI).
About the news
  • Sweden was in top position, followed by Morocco and Lithuania in the CCPI 2019.
  • The bottom five in the list were Saudi Arabia, the US, Iran, South Korea and Taiwan.
  • Morocco, the North African country significantly increased the share of renewable over the past five years and increased new renewable energy capacity.
  • With the connection of the world’s largest solar plant to the grid, Morocco is on track for achieving its target of 42% installed renewable energy capacities by 2020.
  • Sweden is in top position, followed by Morocco and Lithuania in the CCPI 2019.
  • The bottoms five in the list are Saudi Arabia, U.S., Iran, South Korea and Taiwan.
INDIA'S PERFORMANCE
  • India Ranked 11th 
  • Most notable India improved its  performance in Renewable Energy Category joining the group of Medium
  • Comparatively low levels of per capita GHG emissions and a relatively ambitious mitigation target for 2030 give India an overall high rating in the emissions category.
About the index
  • The Climate Change Performance Index (CCPI) is an instrument designed to enhance transparency in international climate politics.
  • Its aim is to put political and social pressure on those countries that have, until now, failed to take ambitious action on climate protection, and to highlight those countries with best practice climate policies.
  • It is annually published by Germanwatch, CAN International and the NewClimate Institute.
  • It evaluates and compares the climate protection and performance of 56 countries and the EU.
  • The ranking results of CCPI 2019 were defined by a country’s aggregated performance regarding 14 indicators within the four categories
  • GHG Emissions
  • Renewable Energy
  • Energy Use
  • Climate Policy

DEVELOPMENT OF WEAK EL NINO

DEVELOPMENT OF WEAK EL NINO


Why in news?
The National Oceanic and Atmospheric Administration (NOAA) of the U.S. recently announced the development of a weak El Nino in the equatorial Pacific Ocean.
What is an El Nino?
  • El Nino is a phenomenon of unusual warming of waters in the equatorial Pacific Ocean off the coast of Chile and Peru.
  • It largely impacts weather events across the world, with excessive rainfall in some areas and dry spells in regions like India, Indonesia and Australia.
  • In India, over the years, El Nino has been found to have strong links in suppressing the monsoon rainfall.
  • On the other hand, the opposite phenomenon of La Nina (unusual cooling) has been found to be helpful in bringing good rainfall.
What is the NOAA outlook?
  • Status of El Nino at this time of the year usually indicates the kind of rainfall to be expected during the monsoon season later in the year.
  • Weak El Nino conditions had already built up in January 2019.
  • It is likely to continue (with 55% probability) until the spring season in the northern hemisphere (mid-March to mid-June).
  • NOAA said that the probability of El Nino persisting into the summer (beyond June) was 50% or less.
  • Significantly, the warming in the Nino 3.4 region of the Pacific Ocean has been forecast to remain in excess of 0.5°C above normal.
  • This is the region whose sea surface temperature (SST) has more connection to the impact on India’s rainfall.
What is the likely impact for India?
  • The data for the last 100 years shows that if the SST in Nino 3.4 is over 0.5°C above normal in the monsoon season, rainfall over India gets affected.
  • However, prediction through the northern spring season (instead of summer) has higher degree of uncertainty.
  • So there is a need for better prediction, for clearer understanding of the impact on Indian monsoons.
  • Moreover, past records show that the impact of El Nino in the monsoon months is relatively high when it is preceded by a La Nina in the winter.
  • Notably, in this winter, sea surface temperatures were above normal, almost close to El Nino; in other words, absence of La Nina.
  • So, even if it occurs, the impact of an El Nino event might not be very large this monsoon.
  • Nevertheless, if El Nino strengthens beyond spring and grows into the summer, India may witness a drought.
  • Some weather events like winds over the western tropical Pacific will finally determine whether El Nino will grow beyond spring.
Is El Nino frequency changing?
  • El Nino events repeat themselves in a 2-to-7-year cycle, with a strong El Nino expected every 10-15 years.
  • However, since 2000, 5 El Nino events have already happened, and this year could witness a sixth one.
  • New scientific research is pointing to increased frequency of extreme El Ninos due to climate change.
  • Such extreme events could happen twice as often as today if the average annual global temperatures reach 1.5°C above pre-industrial times.
  • However, the increasing frequency could be because of other reasons as well.
  • They are related with the fact that trade winds got stronger and the eastern equatorial Pacific Ocean has remained colder since 1998, which makes El Nino more active.
  • The stronger trade winds are not easily explained by global warming, hinting at more complicated reasons.

MAGNETIC NORTH POLE SHIFTING

                       MAGNETIC NORTH POLE SHIFTING


Why in news?
The magnetic north pole is, reportedly, drifting fast away from the Canadian Arctic and towards Russia.
What are the two poles on earth?
  • The Earth has two pairs of north and south poles.
  • The geographic poles are defined by the axis around which the planet rotates, and these are fixed.
  • The Earth behaves much like a giant bar magnet and this behaviour defines its magnetic north and south poles.
  • But these are not static as the geographic poles. [A compass points towards magnetic north.]
https://images.indianexpress.com/2019/02/northpoles.jpg
What causes the magnetic field?
  • The origin of Earth’s magnetism lies in its outer core which is a more than 2,000-km layer that surrounds the central core or the innermost part.
  • The outer core is comprised of liquid iron and some other metals like nickel.
  • This liquid iron is in constant motion due to Earth’s rotation and various other reasons, and this motion produces a magnetic field.
How have the positions changed?
  • The constant motion is the reason for the magnetic poles to not coincide with the geographical poles.
  • It is also why the Earth’s magnetic behaviour is far more complex than that of a simple bar magnet.
  • Resultantly, the magnetic north poles and south poles move around sometimes erratically.
  • Over large periods of time, they change their locations significantly, sometimes even interchanging their positions.
  • Around 780,000 years ago, the magnetic north pole was getting somewhere near where the magnetic south pole currently is.
  • But this time period of shift in positions is not fixed.
What is the recent development?
  • In 1831, it was discovered that the magnetic north pole was located somewhere over northern Canada.
  • Since then, the magnetic north pole has been moving hundreds of miles across the Canadian Arctic towards Russia.
  • It has now been found that the pace of this movement has suddenly increased, quite significantly.
  • It has been moving from about 14-15 km per year till the 1990s to about 55 km per year in the last few years.
  • This, now, led to scientists updating the World Magnetic Model (WMM) that tracks this movement.
  • Every 5 years, a new and updated version of the WMM is released; the current update is a year ahead of the schedule.
  • The faster movement of the magnetic north pole had made WMM so inaccurate that it was about to exceed the acceptable limit for navigational errors.
What is the significance?
  • Given the extremely hot temperatures, the phenomena happening inside the earth can only be studied indirectly or through computer modelling.
  • So the causes for the fast movement are uncertain yet.
  • But the shifting of magnetic north pole would throw some new insights into the phenomena happening deep inside the Earth’s surface.

What is the consequence?
  • A standalone school compass would not be affected by this change. It will reorient itself to the new resultant magnetic north pole.
  • But given its less precise nature and deflections due to local magnetic fields, this is no longer used for modern requirements of navigation.
  • The compasses that are used in modern instrumentation are much more sophisticated, digital and more accurate.
  • The entire transportation sector, especially aviation and shipping, depends on correctly knowing the position of magnetic north.
  • Similarly, it is crucial for militaries, for firing their missiles or for other purposes, and other civilian applications as well.
  • The compasses now have to be recalibrated to reflect the change in the magnetic north pole.
  • The WMM has released a set of software that will update these instruments to the new positions of the magnetic north pole.

Lessons from Fani Cyclone - Climate-risked World

Lessons from Fani Cyclone - Climate-risked World


What was Fani's impact?
  • Cyclone Fani left behind a trail of broken homes, powerlines and infrastructure.
  • Odisha has lost years of its development dividend in one shock.
  • Nevertheless, the fact that there were far fewer fatalities in this cyclone than before is to be acknowledged.
  • Even when wind speeds crossed 170 km/hour and reached 204 km/hour, the loss of human life was contained at 41 (reportedly increased to 70).
  • In contrast, the state had lost 10,000 people in the super cyclone of 1999.
What is the climate change factor here?
  • The 2018 climate assessment by the World Meteorological Organization (WMO) gives some inputs in this regard.
  • Tropical storms in the Northern Hemisphere were up, from 63 in the previous year to 74 in 2018.
  • They were roughly the same, 22, in the Southern Hemisphere.
  • The fact is that there is a big difference in these storms, as the India Meteorological Department (IMD) is finding.
  • The recent storms are being increasingly and crazily unpredictable.
  • In recent years, the IMD has nearly perfected the science of cyclone forecast.
  • But now it is learning, in real time, to change its methods and to advance its technology.
What is the recent evidence to this?
  • Ockhi which hit the Kerala coast in late 2017 took many lives and caught fishermen at sea unawares. 
  • Ockhi went from a deep depression in the ocean to a cyclonic storm in a matter of just 6 hours.
  • The failure to predict and warn was not just human, but because of the unnatural characteristics of such a tropical storm.
  • It changed direction; it gathered steam when least expected and became more intense and more virulent at speeds never seen before.
  • One reason was the intense heat pockets in the ocean, which changed the direction and speed of the cyclone.
What was the case with Fani?
  • As the IMD was prepared for such changes, it used even more sophisticated equipment and improved the prediction models in Fani.
  • But the speed of change was so rapid that the learning of 2017 from Ockhi became outdated.
  • Intensity - Fani intensified from severe to very severe in no time.
  • Landfall - Fani also made landfall ahead of its schedule.
  • It was to hit Odisha by the afternoon; in real time, this meant evacuations should have been completed by then.
  • But Fani landed with ferocity by the morning itself.
  • The fact that the state administration had planned and managed to move people ahead of schedule speaks volumes for the preparedness.
  • Inland - Fani moved inland and reached Bhubaneshwar.
  • But notably, it did not weaken in its wind speed there, as should have been the usual case.
  • This was strange because storms need moisture on land to gather intensity and to lash the land with rain.
  • But it was peak summer, a time when ocean storms never hit in any case.
  • It is still unclear why it moved inland and how should this be predicted in the future.
  • In all, Fani demands that India invest in the science of weather and in the governance capacity to move rapidly to avert disasters.
  • The future is even more risked and even more unpredictable than imagined.